Generate histogram and boxplot of HarvestChoice indicators
Usage
stats(var, iso3 = "SSA", by = NULL)
Arguments
- var
- character array of variable codes to plot
- iso3
- optional country or region filter (3-letter code)
Value
-
plot
Description
Display a histogram and univariate statistics for any selected HarvestChoice variable(s).
See examples below. Note that calling stats(...) is equivalent to calling the
convenience method hcapi(..., format="stats").
Details
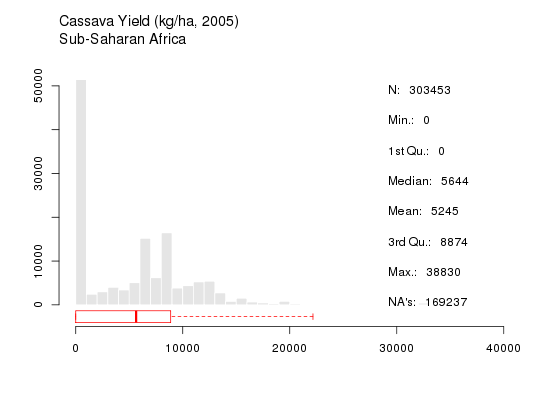
# API call: generate 2 plots showing farming systems and 2012 population density in Ghana
$ curl http://hcapi.harvestchoice.org/ocpu/library/hcapi3/R/stats \
 -d '{"var":["bmi", "cass_y"]}' \
 -X POST -H 'Content-Type:application/json'
 --
/ocpu/tmp/x09db409895/R/.val
/ocpu/tmp/x09db409895/graphics/1
/ocpu/tmp/x09db409895/graphics/2
/ocpu/tmp/x09db409895/source
/ocpu/tmp/x09db409895/console
/ocpu/tmp/x09db409895/info
/ocpu/tmp/x09db409895/files/DESCRIPTION
Use wget (at the command line) to download the generated plot(s)
$ wget http://hcapi.harvestchoice.org/ocpu/tmp/x09db409895/graphics/1/png
$ wget http://hcapi.harvestchoice.org/ocpu/tmp/x09db409895/graphics/2/png
Examples
# Plots of BMI and cassava yield distribution over sub-Saharan Africa
stats(c("bmi", "cass_y"))